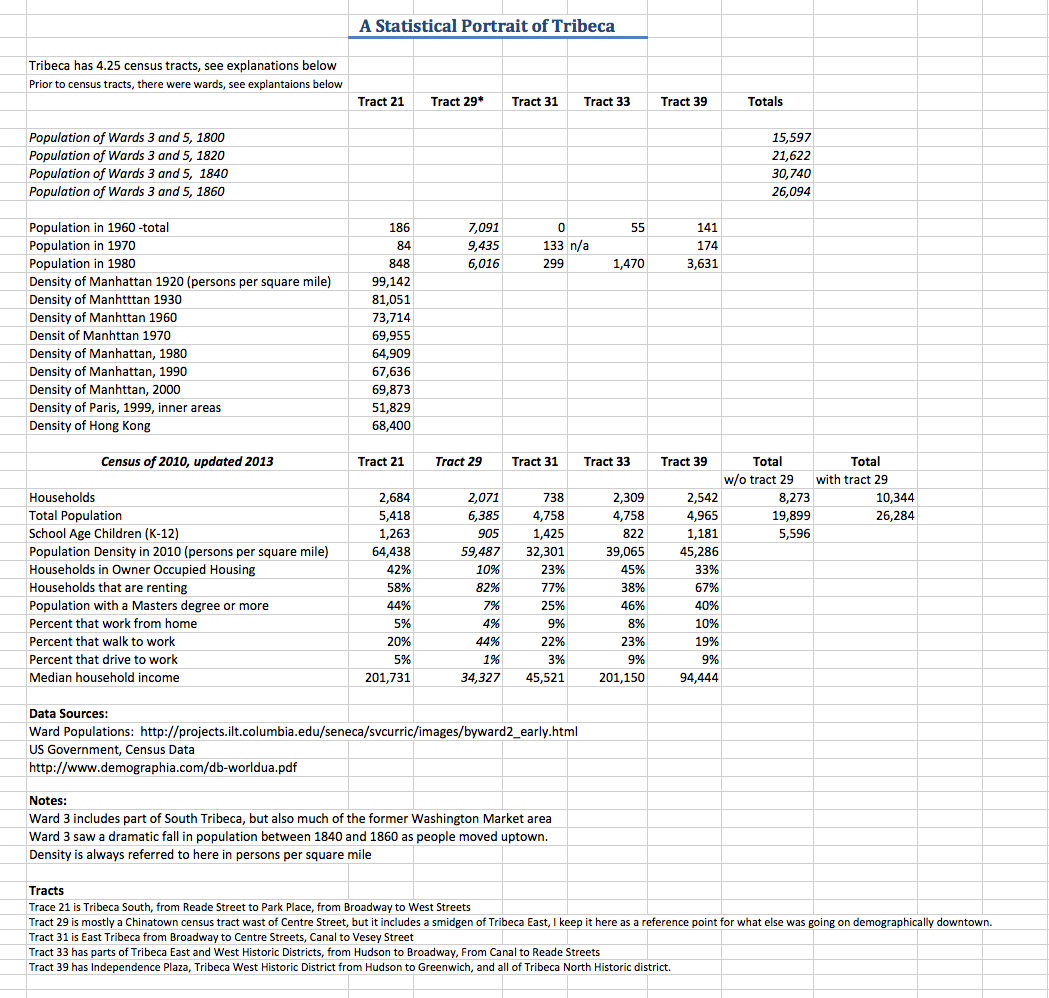
Here is a portrait of Tribeca from the Census Bureau.
Fun facts to be gleaned from the table below:
1. Tribeca is already as dense or even denser than it needs to be. In fact, it may be optimally dense. Tribeca South is denser than Paris (which many, including myself, consider an optimal density). Chinatown and Tribeca South have densities that approach Hong Kong’s – a dubious achievement. Alas, rather than having it spread evenly as it is in Paris, much of the density appears to be coming from high-rise development such as at 105 Duane, Independence Plaza, the Barclays tower, and the buildings on Warren above Whole Foods. The average density of Tribeca taken as a whole is 45,251 people per square mile, a bit under Central Paris density. This means that it is time to shift density elsewhere, in my opinion. The only way to add more is to allow some people to take in boarders, to destroy the historic districts, or to stop the wealthiest among us from creating giant apartments that take up entire floorplates. None of these, I imagine, are palatable solutions, although I am sure REBNY would jump at the idea of destroying the historic districts. See http://www.robertgordonarchitect.com/RGA/Paris_Density.html for a great discussion of Parisian density.
2. In terms of housing units per acre, Tribeca averages 46 housing units per acre (the Google maps measuring tool says Tribeca has 182). Prior to the crazy overdevelopment that is happening at present, we had a total of 8,707 housing units. Parisian density of the typical 6-story 1890’s Hausmannian building results in about 52 housing units per acre, so we are in the sweet spot, or rather, we were in the sweet spot until all this over-scaled construction hit us in the past couple of years. Some say that densities of above 30 housing units per acre are enough to support mass transit, which is another way of saying we are denser than we need to be here in Tribeca. We have areas in Tribeca that are way too dense for the infrastructure of roadway and sidewalk – I am thinking of the area around Whole Foods and the mess that has become Warren Street between Greenwich and West Streets, and I think the Broadway corridor will be a mess if even one more housing unit is put there.
2. It is clear that the public amenities of parks, sidewalks, roadway use, schools, and green areas in Tribeca and Chinatown – areas that ought to constitute vital respite – are lacking at our current high densities both in Tribeca and Chinatown, despite the existence of our “too small” gems such as Washington Market Park and Columbus Park. (Too bad Collect Pond Park turned out to be such a dud, and too bad lovely Canal Park got reconstructed in the middle of what is basically a highway).
3. Tribeca is astonishingly educated. Tract 33, core historic Tribeca, has 46% of its population boasting a Master’s degree or more. That number goes down to a still very respectable 25% in Tract 33. Tribeca is also very wealthy on average, but perhaps not as wealthy as the stereotypes say. Before you roll your eyes, note that these are median figures – which as is true for all such single-unit measures. As such they are heavily distorted by the outsized wealth of our resident celebrities and minority of corporate CEOs who make us seem richer than we are. Remember that half of Tribeca’s households earn less than the cited median figures.
4. We also live next to serious poverty in neighboring Chinatown. In that census tract (#29), half the households make less than $34,000 and 36% of households have incomes that fit the federal definition of poverty.
4. Tribeca has a very high percentage of people who work in what the census bureau calls “Professional, Technical, and Scientific Fields”: 22% in tract 21, 16% in Tract 31, 22% in Tract 33, and 26% in Tract 39. I surmise those percentages are similar to what the Washington Beltway neighborhoods look like, or perhaps Morningside Heights near Columbia.
5. After the complete decimation of Washington Market and the creation of a literal ghost town down here in the 1950’s and 60’s, Tribeca is back to the 1820 population it had when it was largely filled with tiny federal row houses (which had to have been crammed with people in boarding house situations if the numbers are to be credible) in 1820.
6. Tribecans still mostly rent their homes, although the percentage of owner-occupied housing is very high. The ratio of renters to owners is 58/42 in Tract 21, 77/23 in Tract 31, 36/45 in Tract 33, and 67/33 in Tract 39. It is intriguing that in central Tribeca the part that is shared between Tribeca East and West historic district has the highest percentage of home owners (45%).
6. A remarkable number of Tribecans work from home – ranging from 5% in Tract 21 to 10% in Tract 39. Only one census tract downtown beats Tract 39 in that figure, and that is one of the census tracts covering SoHo just on the other side of Canal.
7. Even if Tribecans have cars, most everyone takes the subway to work, but a good percentage walk – about 10%. It is interesting that in neighboring Chinatown census tract, 46% of workers walk to work.
8. The high education, the high proportion of people working from home, and the high number of “professional, scientific, and technical” people here all make for a distinct make-up of Tribeca that I suspect is quite different from the average neighborhood anywhere in the U.S.. I imagine that Tribeca’s large number of self-employed, educated, artistic and highly educated people explain both its appeal and vitality (well, the amazing architecture has something to do with it too). This unique demographic is a fluke of history and not a result of gentrification. As the census data show, Tribeca was indeed empty of inhabitants until the artists moved in. The artists are of course slowly being “bought out” by ever-escalating financial payouts to induce them to leave rent-stabilized or loft law buildings. However, recall that many pioneers of course speculated themselves in real estate development back when prices were cheap. Some pioneers bought whole buildings, and some in turn rented out studios to other artists. The point of mentioning that is to not fall into the trap of painting the pioneers as victims of some unclear gentrification process. The reality is more complicated. But what is also clear is that Tribeca did not just turn into some wealthy enclave filled only with those who work in finance and the census data bear that out. The reality is thus far more interesting and complex, and largely positive.
9. Anyone with more data to share, please do. Also, think about the perplexing factoid that density in Manhattan peaked in 1920. Those were the days of cramming new immigrants into tenements (which I am sure still happens in the boroughs). Manhattan’s density has been declining since then, and declining well before the the financial crises of the late 60’s in NY. That factoid got Joe Rose, the former head of City Planning thinking, and it should get us thinking too, mostly to start questioning classic assumptions about Manhattan. And if Manhattan’s density has been declining for so long, and with all the tons of new construction that has happened in Manhattan since then, how does an affordable housing crisis arise so “suddenly”? And is the issue really a scarcity of housing? The Wall Street Journal did an article this year about an old well-built and recently renovated high-density housing project in the Bronx, near public transport, that nearly always has vacancies. How can that be? Housing markets are weird creatures, and that article should be one indicator to any economist that when talking about the market in affordable housing in this City, we are not in Kansas anymore.
Lynn Ellsworth
Purchase “Tribeca and Its Architecture”